
Devin Hester officially announced his retirement this week, well after NFL teams had made it obvious that his career was over. My Twitter feed was instantly flooded with highlights and memories, and I hope you’ve taken a few moments in the last couple days to remember just how special Hester was. If not, here’s a quick refresher. Well, it’s not that quick, but that’s the point; Hester’s highlight reel is a long one.
Hester is without a doubt the greatest return man in NFL history. His 20 return touchdowns are the most ever. He had 3,786 punt return yards as a Bear, more than 1,000 more than the next highest returner, and his 14.3 yards per punt return led the NFL (minimum 50 attempts) by half a yard over that stretch.
But a common argument has been that Hester’s impact extended beyond his absurd return statistics because teams prioritized kicking away from him, giving the Bears better field position. Using the terrific Game Play Finder from Pro Football Reference, I attempted to see if that actually happened. Special thanks to the wonderful Andrew Link for helping me think through how to do this.
The Setup
In order to do this, I looked at all punts from 2006-2013, the years Devin Hester was a Bear. In order to examine if teams were kicking shorter against the Bears to avoid Hester, I looked at raw punting yardage, which ignores any returns. Then to examine Hester’s total impact, I factored in return yardage for net punting average. Finally, I also examined touchdowns that teams scored on punt returns.
In order to get the best overall understanding of the impact Hester had, I looked at how the Bears compared in each of these three categories to the NFL average, but also how far separated they were from each individual team.
Unsurprisingly, the Bears led the NFL in all three categories, and often by a wide margin. Let’s look through each of them one by one to break it down in a little more detail.
Yards Per Punt
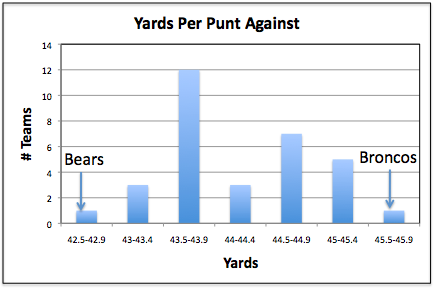
Conventional wisdom says that teams intentionally punted shorter against the Bears to avoid Hester returns, and the numbers absolutely bear that out. From 2006 to 2013, the average NFL punt traveled 44.2 yards, while the average punt against the Bears went only 42.5 yards, the shortest distance in the NFL. A rough spread of all 32 teams is shown in the graph below.

The 42.5 yards per punt against the Bears came in a full 0.7 yards shorter than the next team. This same margin of 0.7 yards per punt was the difference between the 2nd and 16th teams, which means the Bears truly stood alone.
To look at it another way, punts against the Broncos averaged 0.6 yards per punt farther than the next highest NFL team. That means the altitude in Denver made less of a difference in punt length than kicking to Devin Hester did. I find that quite remarkable.
If you’re more of a stats person, Chicago’s z-score here was -2.18, meaning less than 1.5% of results would be expected to beat this.
Net Yards Per Punt
Even though teams kicked it short to try and avoid Hester, he still made them pay quite often. Like I said above, he averaged over 14 yards per punt return as a Bear, best in the NFL among players with 50 or more returns. Although short kicks meant Hester had to call a number of fair catches, the Bears were still the 2nd best team in the NFL with 5.7 average yards per punt (including punts with no return). That means the Bears were even more exceptional in net punting average (punt yardage – return yardage) than they were in just punt yardage.
An average punt against the Bears during Hester’s tenure yielded 36.8 yards of field position, compared to an NFL average of 39.7 in that same time span. As you can see in the graph below, that 36.8 mark is truly remarkable.

Look at that gap between the Bears (far left) and the next team. The difference between the Bears and the 2nd best team here was 1.5 yards, which is the same as the difference between the 2nd and 18th best teams. Once again we see the Bears are about as far ahead of the pack as the next best team is from average.
Again for the stat-heads out there, the z-score this time was -2.68, meaning less than 0.4% of results would be expected to beat this.
Punt Return Touchdowns
Those two categories help illustrate the impact Hester had consistently helping the Bears pick up good field position, but Hester’s greatest value was arguably the game-changing touchdowns that were a semi-regular occurrence. Between 2006 and 2013, there were 121 punt return touchdowns in the NFL, and Hester had 13 of them.
Think about how absurd that is: in an 8 year stretch, one single player accounted for more than 10% of all touchdowns scored via punt return. No other player in the NFL accounted for more than 4 punt return touchdowns in that span, and no other team had more than 8. The graph below illustrates just how far ahead of the pack Hester was.

The difference between Hester and the next best team was the same as the difference between 2nd and 21st teams. So once again we see the Bears are so far out from the pack that they’re basically in a league of their own. And once again for those who are more statistically minded, the z-score here was 3.34, meaning less than 0.4% of results would be expected to beat this. 0.04%.
Wrapping It Up
Devin Hester, you are ridiculous!
We all know that, and I’ve got a bunch of numbers here to back it up. When Devin Hester was a Bear, Chicago was truly in a league of their own when it came to punt returns. He consistently saved them yardage and delivered more big plays than anybody.
I don’t know if Devin Hester will end up in the Hall of Fame or not (though I think he should), but there is no denying the impact he had on special teams over his 8 years in Chicago.

